Definition and Overview of 3D CAD Software
What Is CAD?
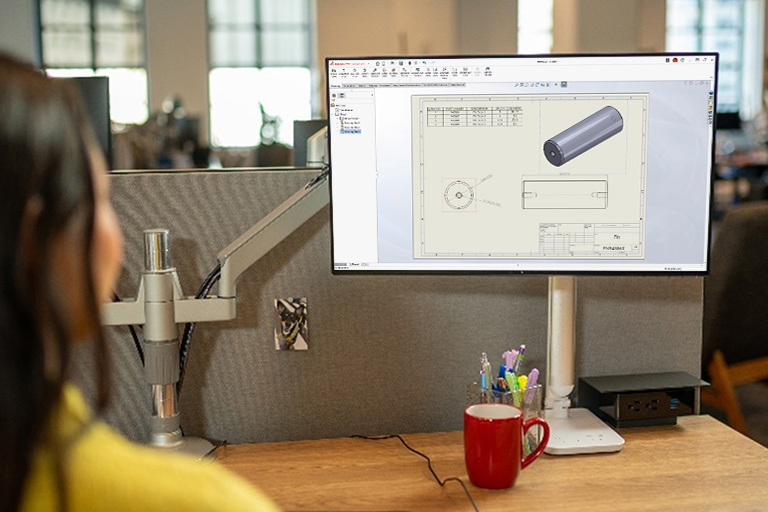
Computer-aided design (CAD) is the use of computer-based design software to create, modify, analyze, and optimize designs digitally. CAD technology replaces traditional hand-drawing methods with sophisticated digital tools that enable engineers and designers to develop precise technical drawings and three-dimensional models. This revolutionary approach to design has fundamentally transformed how products are conceived, developed, and brought to market across virtually every industry.